
Published September 22, 2026
Is Langley a Buyer's or Seller's Market Right Now?

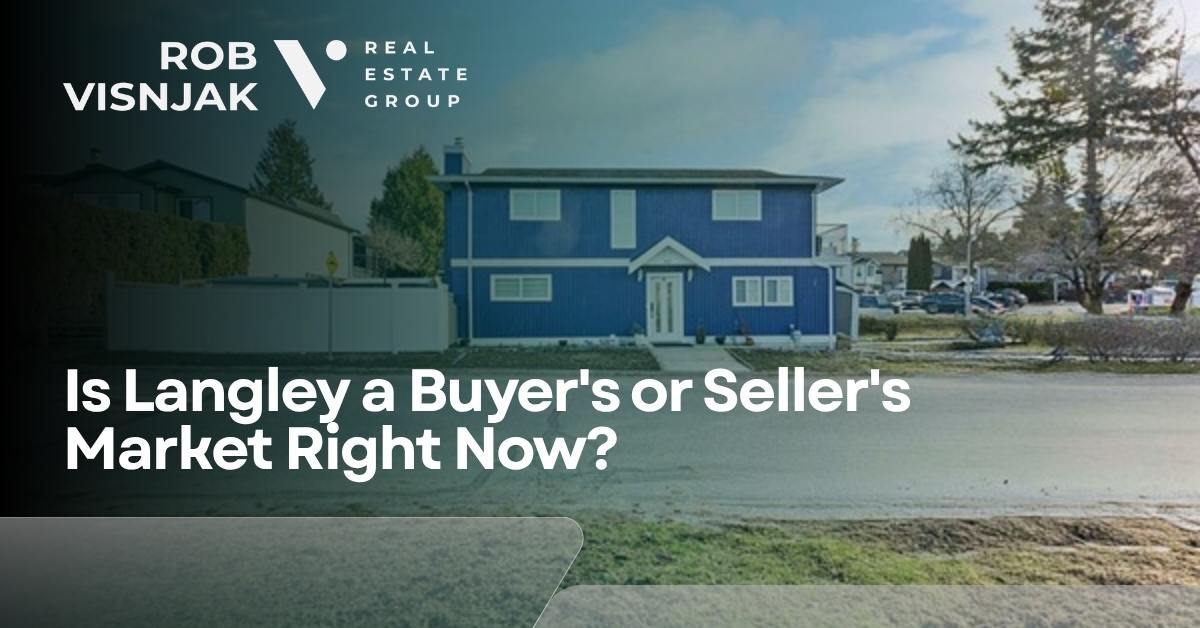
Langley is not a clean seller's market in late 2026. On the Fraser Valley Real Estate Board August file, released September 2, 2026, Langley sat in balanced territory. Combined sales of 196 against 1,111 active listings produced a 17.6% sales-to-active listings ratio, inside the board's 12% to 20% balanced band.
The wider Fraser Valley is a buyer's market. The same release printed 941 board-wide sales against 9,787 active listings, a 10% ratio. Late-September MLS snapshots for Langley then slowed further, with roughly 88 sales against 1,374 actives and a 6.4% absorption rate.
That split is the whole story. Langley still absorbs homes faster than the board average, especially townhouses. Detached homes and condos give first-time buyers more rooms to compare and more room to keep financing and inspection subjects.
How Agents Classify a Buyer's Market vs a Seller's Market
A buyer's market means supply outruns demand. Listings linger, price cuts show up, and offers below asking become normal. A seller's market means demand outruns supply. Homes sell fast, multiple offers return, and list prices stick.
The Fraser Valley Real Estate Board uses the sales-to-active listings ratio as the local scoreboard. Divide monthly sales by active listings. Under 12% favours buyers. Between 12% and 20% is balanced. Over 20% favours sellers.
The British Columbia Real Estate Association adds months of inventory, which is active listings divided by that month's sales. BCREA treats about 5.0 to 8.3 months as a balanced range. Under five months usually tightens toward sellers. Above eight months usually loosens toward buyers.
A third check is sales-to-new-listings. Near 50% means the month's new stock roughly matches the month's sales. Under 40% means listings pile up. Over 60% means new supply is getting absorbed.
The Official August 2026 Call for Langley
August is the last full calendar-month file from the board as of this writing. Use it as the official label. Use September MLS snapshots as a pace check, not as a replacement for the board package.
|
Measure |
Langley Aug 2026 |
Threshold |
Fraser Valley |
Langley read |
|
Sales |
196 |
n/a |
941 |
Summer volume |
|
Active listings |
1,111 |
n/a |
9,787 |
Deep catalogue |
|
Sales-to-active |
17.6% |
12% to 20% balanced |
10% |
Balanced |
|
Months of inventory |
5.7 |
5.0 to 8.3 balanced |
About 10.4 |
Balanced |
|
Sales-to-new listings |
48.5% |
~50% balanced flow |
39.7% |
Balanced flow |
|
Composite benchmark |
$948,600 |
n/a |
$869,900 |
-6.6% year over year |
Source: Fraser Valley Real Estate Board August 2026 MLS statistics, released September 2, 2026. Months of inventory for Langley is 1,111 active listings divided by 196 sales. The board-wide months figure is 9,787 divided by 941.
Langley's 17.6% ratio is not a 2021 frenzy and it is not a distressed dump. It is a market where a well-priced home still sells, and an overpriced home sits.
Why the Fraser Valley Headline Says Buyer and Langley Says Balanced
Board-wide numbers mix Surrey, Langley, North Delta, White Rock, Abbotsford, and Mission. Surrey's inventory pool is large enough to pull the regional ratio down even when Langley townhouses still move.
According to the Fraser Valley Real Estate Board August 2026 release, active listings finished the month 33% above the 10-year seasonal average. The board described a deepening buyer's market for the region as a whole. That description is true for the map. It is not automatic for every street in Langley.
FVREB chair Ishaq Ismail put the regional mood in plain language earlier in the summer: "Buyer urgency has been notably absent from the Fraser Valley market for some time now. With inventory remaining high and competition subdued, buyers know they don't have to rush."
Langley's tighter ratio is why families still lose a clean Willoughby townhouse when they bid late or skip the pre-approval. The same week, a $1.8 million Brookswood house can sit through a second price cut.
Market Balance by Home Type in Langley
Langley is three markets sharing one municipal name. Run the same two formulas on each housing type and the label changes.
|
Home type |
Sales |
Active |
Sales-to-active |
Months of inventory |
|
Detached |
69 |
425 |
16.2% |
6.2 months |
|
Townhouse |
62 |
266 |
23.3% |
4.3 months |
|
Apartment / condo |
65 |
420 |
15.5% |
6.5 months |
|
All Langley types |
196 |
1,111 |
17.6% |
5.7 months |
August 2026 benchmarks sat at $1,479,400 for detached homes, $806,400 for townhouses, and $534,000 for apartments. Year-over-year those marks were down 7.1%, 5.0%, and 8.8%.
Townhouses: the tightest Langley segment
Townhouses cleared the 20% seller threshold in August. Sixty-two sales against 266 actives is a 23.3% ratio and about 4.3 months of supply. That is still not 2021. It is tight enough that a priced-right three-bedroom in Willoughby or Walnut Grove can draw overlapping showings.
First-time buyers use this product as the workhorse. If that is your lane, treat it like a competitive pocket inside a calmer city. Get financing locked, walk the comparable solds, and be ready to write.
Detached homes: balanced, with more leverage above the benchmark
Detached homes printed a 16.2% ratio and 6.2 months of inventory. That is balanced on the board scale. The median August detached sale was $1,315,000, well under the $1,479,400 benchmark, which means the typical closed deal was cheaper than the index home.
Houses priced near recent solds in Walnut Grove, Murrayville, and the more compact Willoughby lots still trade. Houses listed off 2022 peaks, especially above about $1.7 million in Brookswood and Campbell Valley, give buyers time and conditions.
Condos: more choice, slower absorption
Apartments posted the softest flow. Sixty-five sales against 420 actives is 15.5% and 6.5 months of inventory. The sales-to-new-listings ratio was 40.9%, versus the low 50s for houses and townhouses.
Condo sales did jump 35.4% from August 2025, so demand is not dead. The stack is still deep. Older stock and buildings with special levies sit longest. Newer concrete near Langley City amenities moves faster when the list price matches last month's solds.
Late-September Pace: Langley Leans Buyer After Labour Day
Board files close on a calendar month. The live MLS file keeps moving. Late-September 2026 snapshots compiled from Fraser Valley listing data showed about 1,374 active Langley listings and 88 sales over 30 days. That is a 6.4% absorption rate and about 38 average days on market.
House-only samples in the same window showed about 30 detached sales against roughly 660 actives, a 4.5% absorption rate and about 39 days on market. Neighbourhood labels in those snapshots came back as buyer-leaning across Willoughby Heights, Langley City, Walnut Grove, Aldergrove, Fort Langley, and Brookswood.
Do not blend those live counts with the August board package into one fake official number. Read them as direction. After the summer pause, Langley loosened from balanced toward buyer, while townhouses remained the least forgiving product.
|
Neighbourhood snapshot |
Active (late Sep) |
Sold (30 days) |
Absorption |
|
Willoughby Heights |
525 |
41 |
7.8% |
|
Langley City |
263 |
17 |
6.5% |
|
Walnut Grove |
96 |
8 |
8.3% |
|
Aldergrove |
89 |
4 |
4.5% |
|
Fort Langley |
42 |
2 |
4.8% |
Source: late-September 2026 MLS neighbourhood snapshots. Absorption here is 30-day sales divided by current actives. Counts move daily and are not the Fraser Valley Real Estate Board monthly file.
What This Market Means If You Are Buying in Langley
You have more control than you did in 2021 and 2022. You do not have unlimited control. Use the home buying process as a sequence, not a weekend impulse.
• Get a written approval before you shop. The mortgage stress test still caps buying power even when list prices ease.
• Shop by product, not by the word Langley. A Willoughby townhouse and an Aldergrove condo are different markets.
• Keep inspection and financing subjects on most detached homes and older condos. Drop subjects only when the comparable solds and the competition justify it.
• Offer off current solds, not off the original list. Sale-to-list ratios near 97% have been common in recent 30-day samples.
• Compare Langley listings with Surrey before you lock a neighbourhood. The board-wide buyer market is wider in Surrey's larger inventory pool.
If you are starting from scratch, book a buyer consult and walk the last 90 days of solds in the pocket you actually want. Headline benchmarks hide street-level gaps of $80,000 to $200,000.
What This Market Means If You Are Selling
Sellers still sell in Langley. Sellers who price last year's hope do not. The cost of a proud list price is not a lecture. It is 30 to 60 extra days on market and a second reduction that buyers then use against you.
• Price to the last 90 days of solds on your block and housing type. The composite benchmark is a reference, not your list price.
• Townhouse sellers in Willoughby and Walnut Grove can still be firm if the unit is clean, well located, and at the market. Do not confuse that pocket with the whole city.
• Detached and condo sellers should expect conditions. A clean inspection and a flexible completion date beat a stubborn extra $25,000.
• If the home is already listed and quiet, treat that as data. Review the why it did not sell checklist before you throw more days at the same number.
• Get a current home value read before you pick a list price. Then use a full selling plan so the first two weeks of traffic are not wasted.
A balanced-to-buyer market rewards preparation. Staging, photos, and a list price that would have felt conservative in 2022 now look like competence.
Buyer vs Seller Checklist by Scenario
|
Your situation |
Current label |
Practical move |
|
Buying a Willoughby townhouse |
Seller-leaning pocket |
Pre-approve, watch new listings daily, write a complete offer |
|
Buying a Langley City condo |
Buyer-leaning |
Compare buildings, ask about levies, keep subjects |
|
Buying detached under $1.5M |
Balanced |
Use recent solds, request inspection, avoid bidding theatre |
|
Buying detached over $1.7M |
Buyer |
Take time, negotiate extras, do not chase the first showing |
|
Selling a priced-right townhouse |
Still competitive |
Launch ready in week one |
|
Selling an overpriced house |
Buyer |
Recut the price now, not after 45 days |
How This Ties to Prices, Inventory, and Days on Market
Market balance is the label. Prices, inventory, and days on market are the evidence. Langley's composite benchmark of $948,600 was down 0.8% from July and 6.6% from August 2025. That is a grind lower, not a collapse.
For the full price and inventory breakdown by type, use the companion Langley market notes on prices, inventory, and days on market, then come back to this page for the buyer-versus-seller call. For the regional backdrop, stack it against the Fraser Valley board-wide trend. When you are ready to act, buy with a local plan rather than waiting for a headline that already happened.
FAQ: Langley Buyer's Market vs Seller's Market
Is Langley a buyer's market or a seller's market right now?
Langley was a balanced market in August 2026 on Fraser Valley Real Estate Board math. Combined sales of 196 against 1,111 active listings produced a 17.6% sales-to-active ratio, inside the 12% to 20% balanced band. Late-September MLS snapshots showed slower absorption and more listings, which leans buyer. The wider Fraser Valley board printed 10%, a buyer's market.
What sales-to-active ratio means a buyer's market in the Fraser Valley?
The Fraser Valley Real Estate Board treats a sales-to-active listings ratio under 12% as a buyer's market, 12% to 20% as balanced, and over 20% as a seller's market. The British Columbia Real Estate Association also uses months of inventory, with 5.0 to 8.3 months typically treated as balanced.
Are Langley townhouses still a seller's market?
In August 2026, Langley townhouses posted a 23.3% sales-to-active ratio and about 4.3 months of inventory. That is seller-leaning on the board's 20% threshold. Detached homes at 16.2% and apartments at 15.5% sat in balanced territory with more room to negotiate.
Does a buyer's market mean I should wait to buy in Langley?
A buyer-leaning market means more choice and more subject conditions, not a guaranteed price crash. Langley benchmarks were already 5.0% to 8.8% below August 2025 by housing type. Waiting only helps if your payment, stress-test approval, and target neighbourhood still line up later.
What should Langley sellers do in this market?
Price against the last 90 days of solds on your street, not 2022 peaks. Well-priced townhouses in Willoughby and Walnut Grove still move. Overpriced detached homes and older condos sit. If a listing stalls, change the strategy instead of waiting for a frenzy the 10% board-wide ratio does not support.
How is Langley different from Surrey right now?
Langley's August 2026 sales-to-active ratio of 17.6% was tighter than the Fraser Valley board's 10% buyer-market print. Surrey is a larger inventory pool and pulls the board-wide number down. Shop both cities by housing type, not by the regional headline.

Rob Visnjak Personal Real Estate Corp
Team Lead | ROB VISNJAK REAL ESTATE GROUP
or another way